Stocks pull back modestly from all-time highs as investors await fresh catalysts amid government shutdown data blackout
TL;DR
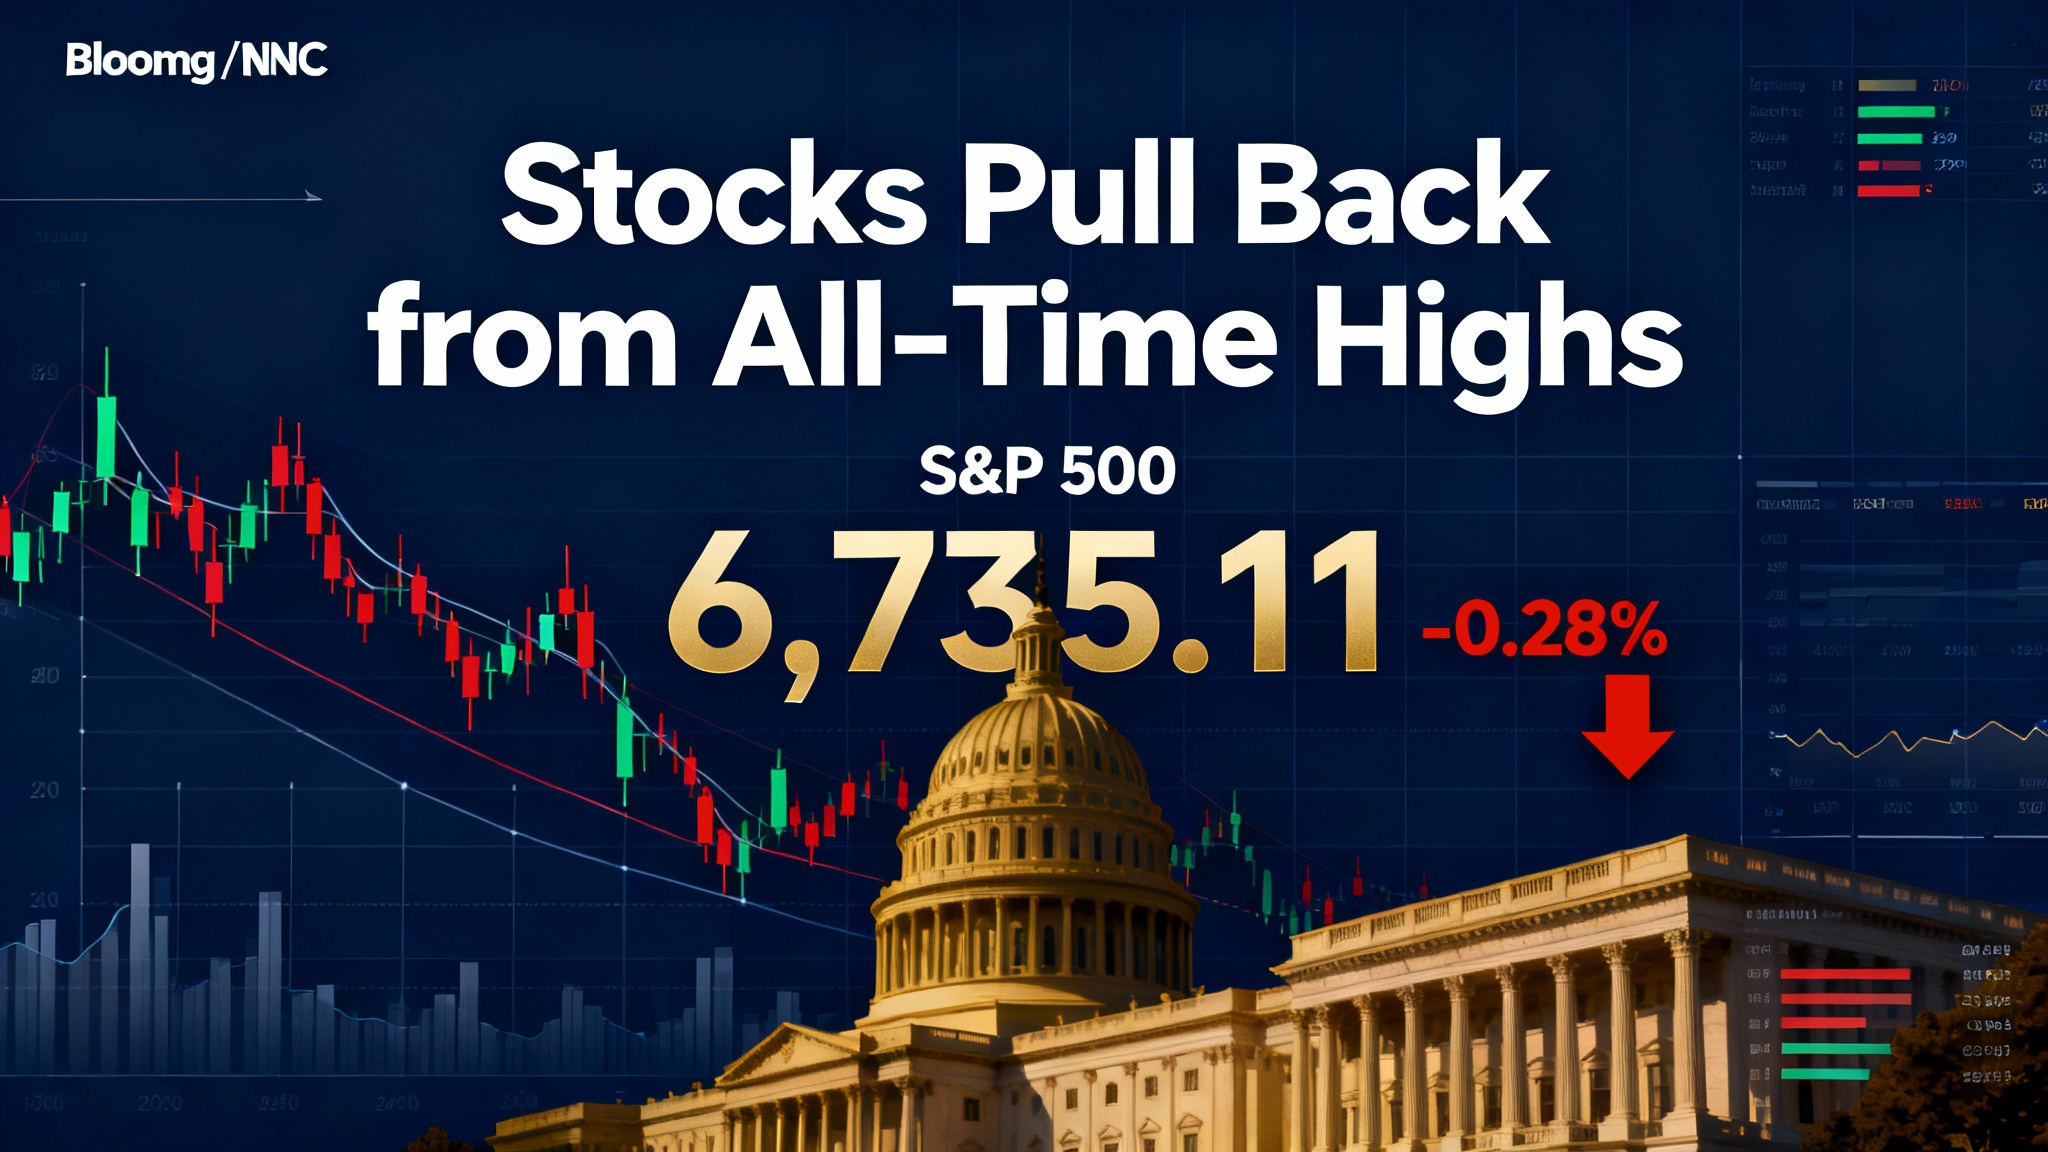
- S&P 500 closed at 6,735.11, down 0.28% after hitting record highs earlier this week
- Dow Jones fell 0.52% to 46,358.42; Nasdaq dipped 0.08% to 23,024.63
- Energy sector led decliners with 1.3% loss; Consumer Staples gained 0.6%
- VIX remains subdued at 16.53, signaling low volatility expectations
- Gold holds above $4,000/oz milestone; Bitcoin retreats to $121,500 from recent highs
- Treasury yields ease slightly: 10-year at 4.11%, 2-year at 3.58%
- Government shutdown enters 10th day, delaying key economic data releases
Introduction: A Healthy Pause in the Rally
After a blistering run that saw the S&P 500 and Nasdaq Composite notch multiple record highs this week, U.S. equity markets took a well-deserved breather on October 10, 2025. The modest pullback comes as investors digest the recent gains and navigate an unusual information vacuum created by the ongoing government shutdown, now in its second week [1][2].
Despite the lack of fresh economic data—with critical reports like inflation figures and employment numbers delayed—markets remain remarkably calm. The VIX “fear gauge” sits at a comfortable 16.53, well below the 20 threshold that typically signals heightened anxiety [3]. This suggests investors are treating the current pause as consolidation rather than capitulation, with many eyeing the upcoming earnings season and potential Federal Reserve rate cuts as the next catalysts.
Market Snapshot: Indices, Breadth, and Volatility
Major Indices Performance
S&P 500 (SPX): 6,735.11 | -0.28% | -18.74 points
The broad market benchmark retreated from Wednesday’s all-time high of 6,753.85 but remains up over 10% year-to-date. The index has now gone 33 consecutive trading days without a 1% move in either direction—a testament to the market’s unusual stability [1][4].
Dow Jones Industrial Average (DJIA): 46,358.42 | -0.52% | -242 points
The blue-chip index underperformed, weighed down by industrial and consumer discretionary names. Boeing led decliners with a 4.14% drop to $216.00, continuing its struggles with aerospace sector headwinds [5].
Nasdaq Composite (COMP): 23,024.63 | -0.08% | -18.75 points
Tech-heavy Nasdaq showed resilience, with AI-related stocks providing support. The index had surged 1.12% on October 8 to a record 23,043.38 before pulling back [6].
Russell 2000 (RUT): 2,468.85 | -0.61% | -15.20 points
Small-caps gave back some gains after hitting an all-time high above 2,500 earlier this week, reflecting profit-taking in the recent outperformer [7].
Market Breadth and Sentiment
Market internals showed mixed signals, with declining issues outnumbering advancers but not dramatically so. The advance-decline line—a key breadth indicator—has been trending sideways to slightly lower despite index gains, suggesting the rally has been somewhat narrow and concentrated in mega-cap technology stocks [8].
VIX (Volatility Index): 16.53 | +0.55%
The CBOE Volatility Index ticked up modestly but remains in the “low volatility” zone below 20, indicating investors expect continued calm in the near term [3].
U.S. Dollar Index (DXY): 99.35 | -0.19%
The greenback eased slightly after recent strength, providing some relief to commodities and international stocks [9].
S&P 500: What Happened, Why It Matters, What to Watch
What Happened
The S&P 500’s 0.28% decline was the index’s second consecutive down day after reaching record territory on October 8. The pullback was orderly and volume-light, characteristic of a market taking a pause rather than reversing course. Notably, the index closed just 0.3% below its all-time high—hardly a cause for concern [1][4].
Why It Matters
This consolidation phase is actually healthy for the market’s long-term trajectory. After a 10.7% year-to-date gain and multiple record highs in a single week, some profit-taking is natural and expected. The fact that the VIX remains subdued and Treasury yields are stable suggests this is a “buy the dip” mentality rather than a “head for the exits” moment [3][10].
The government shutdown adds an unusual wrinkle. With key economic data delayed—including inflation reports and employment figures—investors are flying somewhat blind. However, markets have largely shrugged off the shutdown so far, focusing instead on corporate earnings and Federal Reserve policy signals [1][2].
What to Watch
Earnings Season Kickoff: Major banks including JPMorgan Chase and Citigroup report next week, setting the tone for Q3 results [1].
Fed Communications: With economic data on hold, Fed officials’ speeches take on outsized importance. Markets are pricing in a 98.5% probability of the target rate remaining at 3.75-4.00% at the October 29 FOMC meeting, with an 82.2% chance of cuts totaling 0.75% by year-end [11].
Shutdown Resolution: Any progress on budget negotiations could unlock delayed data releases and provide clarity on the economic picture.
S&P 500 Sectors: Winners, Losers, and Rotation Signals
The sector performance on October 10 revealed a defensive tilt, with investors rotating into staples and out of cyclicals—a pattern that often emerges during periods of uncertainty.
Sector Performance Breakdown
Consumer Staples (XLP): +0.61%
The day’s clear winner, defensive staples benefited from safe-haven flows. Companies like Procter & Gamble and Coca-Cola provided ballast as investors sought stability [4][12].
Information Technology (XLK): -0.07%
Tech held up remarkably well despite being the largest sector by weight (31.6% of the S&P 500). NVIDIA gained 1.83% to $192.57, continuing its AI-driven rally, while Salesforce added 2.04% [5][12].
Health Care (XLV): -0.16%
Pharmaceuticals showed resilience, with Merck up 1.27% to $87.50, though the sector overall dipped slightly [5][12].
Financials (XLF): -0.33%
Banks and financial services lagged, with JPMorgan Chase up just 0.49% as investors awaited earnings reports [5][12].
Communication Services (XLC): -0.57%
Media and telecom stocks underperformed, reflecting concerns about advertising revenue and competitive pressures [4][12].
Industrials (XLI): -1.44%
Cyclical industrials took a hit, with Boeing’s 4.14% plunge weighing heavily on the sector. Supply chain concerns and economic uncertainty dampened sentiment [5][12].
Energy (XLE): -1.36%
Oil and gas stocks slumped as WTI crude fell 1.28% to $60.72/barrel on easing Middle East tensions and oversupply fears [13][12].
Materials (XLB): -1.37%
Commodity-related stocks declined alongside copper and other industrial metals, reflecting concerns about global demand [12].
Real Estate (XLRE): -0.44%
REITs remained under pressure from elevated interest rates, despite hopes for Fed cuts [12].
Utilities (XLU): -0.23%
Defensive utilities saw modest selling, though they remain near record highs [12].
Consumer Discretionary (XLY): -0.50%
Retailers and consumer-facing companies struggled, with Home Depot down 1.59% and Walt Disney falling 0.80% [5][12].
Rotation Insights
The sector performance suggests a subtle shift from growth to value and from cyclicals to defensives. This rotation pattern often emerges when investors anticipate economic headwinds or simply want to lock in gains after a strong run. The outperformance of Consumer Staples alongside weakness in Energy and Industrials hints at caution, though the modest magnitude of moves suggests this is more tactical repositioning than panic [14].
Dow Jones Industrial Average: Blue-Chip Divergence
The Dow’s 0.52% decline—its worst performance among major indices—reflected weakness in its industrial and consumer-facing components. The 30-stock average has been underperforming the S&P 500 and Nasdaq in recent months, a divergence that bears watching.
Top Movers
Gainers:
- NVIDIA (NVDA): +1.83% to $192.57 — AI chip demand remains robust, with CEO Jensen Huang noting “substantially” higher computing demand [1][5]
- Salesforce (CRM): +2.04% to $245.33 — Cloud software strength continues [5]
- Merck (MRK): +1.27% to $87.50 — Pharmaceutical resilience [5]
- Amazon (AMZN): +1.12% to $227.74 — E-commerce and AWS growth [5]
Decliners:
- Boeing (BA): -4.14% to $216.00 — Aerospace challenges persist with supply chain and regulatory issues [5]
- Home Depot (HD): -1.59% to $377.69 — Retail sector headwinds [5]
- Nike (NKE): -1.49% — Consumer discretionary weakness [5]
- Verizon (VZ): -1.19% — Telecom sector pressure [5]
The Dow’s underperformance versus the Nasdaq highlights the ongoing leadership of technology and AI-related stocks, while traditional industrials and consumer names struggle to keep pace. This divergence could signal a maturing bull market where gains become increasingly concentrated—a pattern that historically precedes broader market volatility [5].
Gold & Commodities: Safe Havens Shine, Energy Stumbles
Gold: Breaking New Ground
Spot Gold: $4,000.00/oz | +0.5% (approx)
Gold’s surge above the psychologically significant $4,000 level represents a historic milestone, driven by a potent mix of economic uncertainty, geopolitical tensions, and central bank demand [15].
Key Drivers:
- Economic Uncertainty: The government shutdown and delayed data releases have amplified safe-haven demand, with gold benefiting from its traditional role as a hedge against instability [15]
- Central Bank Buying: Emerging market central banks have doubled their gold reserves over the past three years, adding over 1,000 tons annually as they diversify away from the U.S. dollar [15]
- Weaker Dollar: The DXY’s 10% decline since January 2025 has made gold more attractive to international buyers [9][15]
- Real Yields: Lower real interest rates reduce the opportunity cost of holding non-yielding gold [15]
J.P. Morgan has raised its gold forecast to $4,900/oz by 2026, citing sticky ETF inflows and persistent geopolitical risks [15].
Oil: Easing Tensions, Rising Inventories
WTI Crude: $60.72/barrel | -1.28%
Brent Crude: ~$64.00/barrel | -1.2% (est)
Oil prices declined on news of a potential Israel-Hamas ceasefire agreement, which would reduce the geopolitical risk premium that had supported prices in recent weeks [13]. Additionally, U.S. crude inventories rose by 3.72 million barrels for the week ending October 3, exceeding expectations and signaling adequate supply [13].
OPEC+ announced a modest production increase for November, smaller than market expectations, which helped temper fears of an oversupply glut [13]. However, weak demand signals from China and Germany continue to weigh on the outlook.
Copper: Supply Disruptions Support Prices
Copper: $5.12/lb | +0.02%
LME 3-Month: $10,669/ton | -0.85%
Copper prices held near multi-month highs despite modest daily declines, supported by supply disruptions in Chile and Indonesia. Codelco’s 25% production decline in August and Freeport-McMoRan’s delayed ramp-up at the Grasberg mine have tightened global supply [16]. Strong demand from electric vehicle and renewable energy sectors provides additional support, with forecasts pointing to potential deficits in 2026 [16].
Bitcoin: Crypto King Catches Its Breath
Bitcoin (BTC/USD): $121,545 | -1.4%
24-Hour Range: $119,812 – $123,739
Bitcoin pulled back from its recent all-time high of $126,296 reached on October 7, as profit-taking and a stronger U.S. dollar weighed on the cryptocurrency [17]. Despite the retreat, Bitcoin remains up over 40% year-to-date, significantly outperforming traditional equity indices.
What’s Driving Bitcoin
Institutional Inflows: Bitcoin ETFs recorded record inflows of $5.95 billion globally in the week ending October 4, with U.S. spot Bitcoin ETFs alone seeing $522 million in daily inflows [17]. This institutional adoption continues to reduce exchange reserves and tighten supply.
Dollar Strength: The U.S. Dollar Index’s recent rise has pressured risk assets, including Bitcoin. The “debasement trade unwind”—where investors had been fleeing the dollar for Bitcoin and gold—has partially reversed as expectations for prolonged high interest rates solidify [17].
Correlation with Risk Assets: Bitcoin’s 1.4% decline mirrored weakness in other risk assets, with Ethereum falling 4.3% to $2,950 and Solana dropping 4% to $157 [17]. This correlation suggests Bitcoin is still trading as a risk-on asset rather than a true safe haven.
Outlook
Analysts remain bullish on Bitcoin’s medium-term prospects, with targets ranging from $130,000 to $135,000 in the near term, driven by continued ETF adoption and potential Federal Reserve easing [17]. However, the current pullback is viewed as healthy consolidation after a parabolic run, with support at $120,000 and resistance at $125,000-$130,000 [17].
Bonds & Interest Rates: Yield Curve Watch
Treasury Yields Ease Modestly
10-Year Treasury Yield: 4.11% | -3 basis points
2-Year Treasury Yield: 3.58% | -2 basis points
30-Year Treasury Yield: ~4.35% | -2 basis points (est)
Treasury yields edged lower on October 10 as investors sought safety amid the government shutdown and lack of fresh economic data [10][18]. The 10-year yield’s decline from 4.14% earlier in the week reflects modest demand for safe-haven bonds, though yields remain elevated by historical standards.
Yield Curve: Still Positive, But Flattening
2s10s Spread: 0.54% (54 basis points)
The yield curve remains positively sloped, with the 10-year yield above the 2-year—a “normal” configuration that typically signals economic expansion expectations [19]. However, the spread has narrowed from recent highs, suggesting some caution about growth prospects.
Historically, yield curve inversions (when short-term yields exceed long-term yields) have preceded recessions. The current positive slope indicates the market is not pricing in imminent recession risk, though the flattening trend bears monitoring [19].
Federal Reserve Path: Cuts on the Horizon
CME FedWatch Tool Probabilities:
- October 29 FOMC Meeting: 98.5% chance of rates staying at 3.75-4.00% [11]
- December 10 FOMC Meeting: 77.7% chance of rates falling to 3.50-3.75% [11]
- Year-End 2025: 82.2% probability of cumulative cuts totaling 0.75% (three 25bp cuts) [11]
The Fed’s September meeting minutes revealed division among officials on the pace of rate reductions, balancing labor market risks with persistent inflation concerns [1][10]. With the government shutdown delaying key economic data, Fed officials’ speeches have taken on outsized importance in guiding market expectations.
Impact on Equities
Lower yields are generally supportive of equity valuations, particularly for growth stocks whose future earnings are discounted at lower rates. The current yield environment—with the 10-year below 4.15%—remains accommodative for stocks, though any unexpected spike in yields could trigger volatility [10].
Macro Watch: What’s Coming Next Week
With the government shutdown creating an economic data blackout, investors are focused on alternative indicators and upcoming events that could provide market direction.
Key Dates and Events
Monday, October 13:
- No major economic releases due to shutdown
- Watch for any budget negotiation updates
Tuesday, October 14:
- Potential resumption of economic data if shutdown ends
- Fed speakers: Watch for commentary on inflation and rate path
Wednesday, October 15:
- Retail Sales (if shutdown ends) — Key indicator of consumer spending strength
- Industrial Production — Manufacturing sector health check
Thursday, October 16:
- Jobless Claims (if shutdown ends) — Labor market pulse
- Philadelphia Fed Manufacturing Index — Regional economic activity
Friday, October 17:
- Housing Starts and Building Permits (if shutdown ends) — Real estate sector momentum
- Consumer Sentiment (University of Michigan final) — Confidence gauge
Earnings Season Heats Up
Week of October 13-17:
- JPMorgan Chase (JPM) — Friday, October 17 (before market open)
- Citigroup (C) — Friday, October 17 (before market open)
- Wells Fargo (WFC) — Friday, October 17 (before market open)
- Bank of America (BAC) — Expected mid-week
The major banks’ Q3 results will set the tone for earnings season, with investors focused on net interest margins, loan growth, and credit quality. Strong results could provide the catalyst for the next leg higher in the market [1].
Risks and Counterpoints: What Could Go Wrong
While the market’s calm demeanor suggests confidence, several risks lurk beneath the surface:
Government Shutdown Escalation
If the shutdown extends beyond two weeks, the economic impact could intensify. Federal workers missing paychecks, delayed tax refunds, and disrupted government services could weigh on consumer spending and business confidence [1][2]. The longer the data blackout persists, the more uncertainty creeps into market pricing.
AI Bubble Concerns
The concentration of gains in AI-related stocks—particularly NVIDIA and the “Magnificent 7″—has some strategists warning of bubble dynamics. If AI monetization disappoints or competition intensifies, the narrow leadership could quickly reverse, dragging the broader market lower [1][4].
Inflation Persistence
With the Fed divided on the pace of rate cuts, any upside surprise in inflation data (once released) could force a hawkish pivot. Sticky inflation in services and housing could keep rates “higher for longer,” pressuring equity valuations [10][11].
Geopolitical Wildcards
While the potential Israel-Hamas ceasefire is positive for oil prices, geopolitical tensions remain elevated. Any escalation in the Middle East, Ukraine, or U.S.-China relations could trigger risk-off moves [13].
Valuation Concerns
The S&P 500 trades at elevated valuations by historical standards, with the forward P/E ratio above 20x. If earnings disappoint or economic growth slows, multiple compression could lead to a sharper correction than the modest pullbacks seen recently [4].
Quick Calendar: Mark Your Calendar
October 13 (Monday):
- Watch for shutdown resolution news
October 14 (Tuesday):
- Fed speakers (if scheduled)
- Potential data releases resume
October 15 (Wednesday):
- Retail Sales (if available)
- Industrial Production (if available)
October 16 (Thursday):
- Jobless Claims (if available)
- Philadelphia Fed Index
October 17 (Friday):
- Major Bank Earnings: JPMorgan, Citigroup, Wells Fargo
- Housing Starts
- Consumer Sentiment (final)
October 29 (Wednesday):
- FOMC Meeting Decision — Rate decision and Powell press conference
Conclusion: Patience Pays in This Market
October 10’s modest pullback is best viewed as a healthy pause in an ongoing bull market rather than the start of a correction. With the S&P 500 just 0.3% off all-time highs, the VIX subdued, and Treasury yields stable, the market’s underlying tone remains constructive.
The government shutdown adds an unusual layer of uncertainty, but markets have proven adept at looking through short-term political noise. Once the data blackout ends and earnings season kicks into high gear, investors will have clearer visibility into the economy’s trajectory and corporate health.
What to Watch
- Shutdown resolution — The sooner economic data resumes, the better for market clarity
- Bank earnings — Q3 results will set the tone for the rest of earnings season
- Fed communications — With data delayed, Fed speakers’ commentary takes on outsized importance
- Sector rotation — Watch for continued shifts from growth to value and cyclicals to defensives
- Technical levels — S&P 500 support at 6,700, resistance at 6,800
For now, the path of least resistance remains higher, supported by expectations of Fed rate cuts, resilient corporate earnings, and still-strong consumer spending. But with valuations elevated and risks lurking, maintaining diversification and staying nimble will be key to navigating the months ahead.
As always, this is a market of stocks, not a stock market—individual security selection and sector positioning matter more than ever in this environment.
Disclaimer
This blog post is for informational and educational purposes only and should not be construed as financial advice. The information presented is based on publicly available data and analysis as of October 10, 2025. Market conditions can change rapidly, and past performance is not indicative of future results.
Investing in stocks, bonds, commodities, and cryptocurrencies involves risk, including the potential loss of principal. Before making any investment decisions, readers should conduct their own research, consider their financial situation and risk tolerance, and consult with a qualified financial advisor.
The author and publisher of this content do not guarantee the accuracy, completeness, or timeliness of the information provided and are not responsible for any investment decisions made based on this content. All investments carry risk, and readers should be aware that they could lose some or all of their invested capital.
Sources
- CNBC – Stock Market Today Live Updates (October 9, 2025)
- CNN Markets
- CBOE Volatility Index (VIX)
- Bloomberg Markets – Sectors
- Business Insider – Dow Jones Market Movers
- CNBC – Stock Market Today Live Updates (October 8, 2025)
- Investing.com – Russell 2000
- Fidelity – Advance-Decline Line
- TradingView – U.S. Dollar Index
- CNBC – US Treasury Yields (October 9, 2025)
- CME Group – FedWatch Tool
- Sector SPDRs – Sector Tracker
- Trading Economics – Crude Oil
- Investopedia – Sector Rotation
- J.P. Morgan – Gold Prices Outlook
- Trading Economics – Copper
- Bitcoin Magazine – Bitcoin Price Analysis
- YCharts – 2-Year Treasury Rate
- FRED – 10-Year/2-Year Treasury Spread