Wall Street rebounds sharply from tariff-fueled selloff as investors digest eased rhetoric and major bank earnings
TL;DR
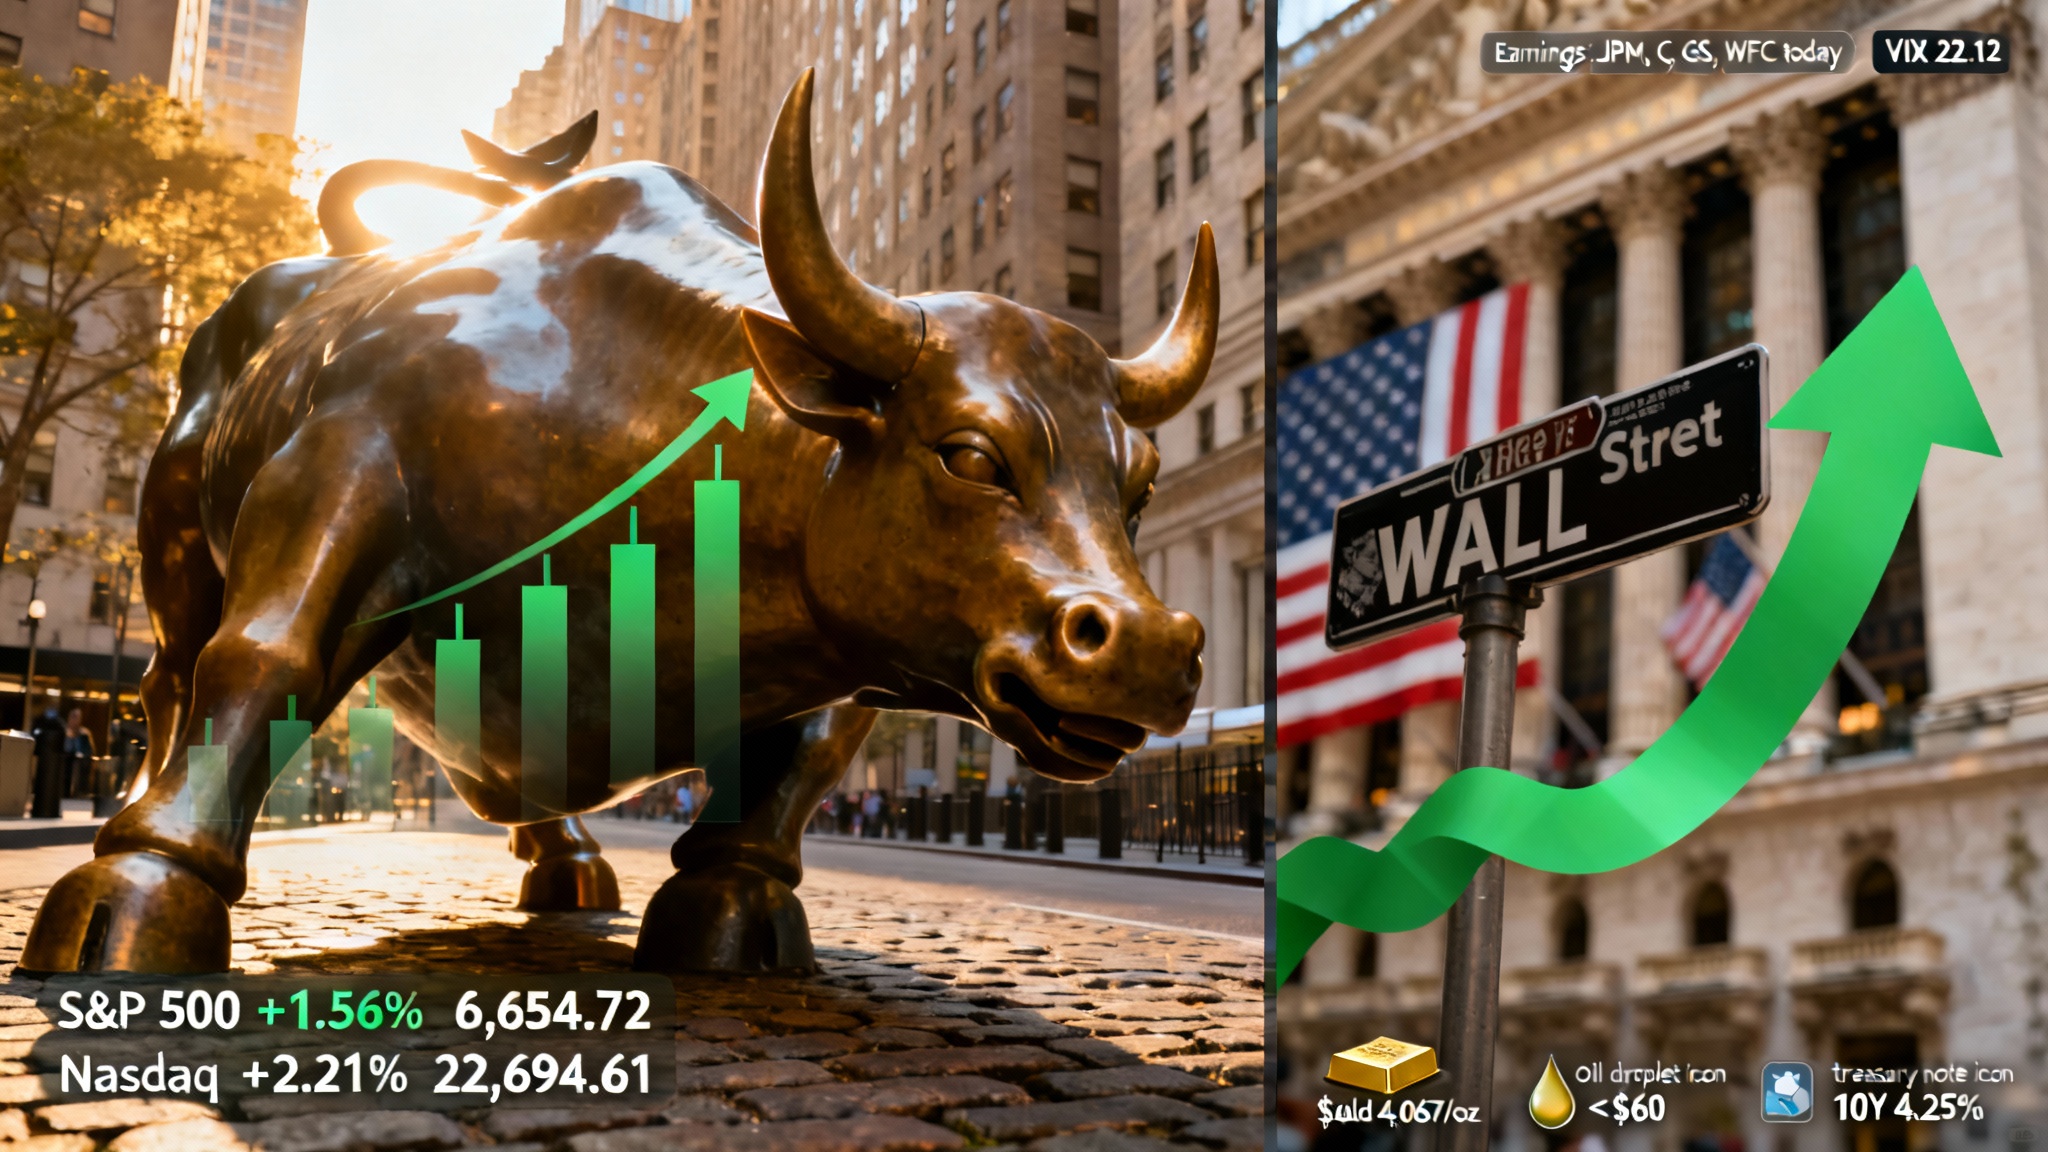
- S&P 500 jumps 1.56% to 6,654.72; Nasdaq soars 2.21% to 22,694.61; Dow gains 1.29%
- Trade tensions ease: Trump softens tariff stance after threatening 100% China tariffs
- Earnings season kicks off: JPMorgan, Citigroup, Goldman Sachs, Wells Fargo report today
- VIX spikes 16.24% to 22.12 amid lingering uncertainty
- Gold hits record high of $4,067/oz; oil slides below $60/barrel
- Treasury yields dip: 10-year at 4.01%, 2-year at 3.48% as safe-haven demand persists
- Bitcoin retreats to ~$110,896 with $326.5M in ETF outflows
Introduction
After one of the most volatile weeks in recent memory, U.S. stock markets staged a powerful comeback on Monday, October 14, 2025, as investors exhaled following a weekend that saw President Trump dial back his most aggressive trade threats against China. The rebound erased a chunk of Friday’s brutal selloff, which had wiped nearly $2 trillion from market capitalization and sent the Nasdaq tumbling over 3.6% [1][2].
But this isn’t just relief rally theater—it’s also opening night for Q3 earnings season, with Wall Street’s biggest banks taking center stage. The combination of eased geopolitical tensions and fresh corporate results is giving traders plenty to chew on, even as the government shutdown enters its second week and key economic data remains MIA.
Market Snapshot
Major Indices Close Strong
U.S. equities delivered across the board on Monday, with technology stocks leading the charge:
- S&P 500: +1.56% to 6,654.72
- Nasdaq Composite: +2.21% to 22,694.61
- Dow Jones Industrial Average: +1.29%
- Russell 2000: +2.79% to 2,461.42 [1][2][3]
Market breadth was decidedly positive, with advancers outnumbering decliners and volume running above average—a sign that this wasn’t just algorithmic window dressing but genuine buying interest across sectors [2].
Fear Gauge Jumps Despite Rally
In a twist that underscores lingering anxiety, the CBOE Volatility Index (VIX) spiked 16.24% to 22.12, even as stocks rallied [4]. This elevated reading—well above the long-term average of around 15—suggests investors are hedging aggressively, perhaps anticipating more turbulence ahead. The VIX had briefly touched 60.13 in April 2025 during peak panic, so today’s level indicates caution rather than terror [4].
Dollar Holds Steady, Yields Retreat
The U.S. Dollar Index (DXY) edged up 0.16% to 99.42, reflecting modest safe-haven demand [5]. Meanwhile, Treasury yields pulled back as investors sought safety:
- 10-year yield: 4.01% (-13 bps from recent highs)
- 2-year yield: 3.48% (-3 bps)
- 2s10s spread: 0.53%, maintaining a positive slope [6][7][8]
The yield curve remains upward-sloping, a healthy sign that markets aren’t pricing in imminent recession—at least not yet.
S&P 500: Tech Powers the Comeback
What Happened
The S&P 500’s 1.56% surge was broad-based but tech-heavy, with the index reclaiming the 6,650 level after Friday’s drubbing sent it below 6,550 [2]. The rally was fueled by a combination of short-covering, bargain hunting, and genuine optimism that the U.S.-China trade war might not spiral into full-blown economic catastrophe.
Why It Matters
This rebound is critical for sentiment. After President Trump’s Friday threat of 100% tariffs on Chinese goods—which triggered the worst single-day drop since early 2024—his weekend social media posts struck a more conciliatory tone, suggesting negotiations might resume [1][2]. China’s response was measured, with export restrictions on rare earth minerals but no immediate escalation, giving markets room to breathe [1].
The S&P 500 is now up 17.19% year-to-date, though it’s given back some of its earlier gains amid the recent volatility [9]. With earnings season underway, the index’s trajectory will hinge on whether corporate America can deliver on lofty profit expectations—analysts are forecasting 8.0% year-over-year earnings growth for Q3 2025 [10].
What to Watch
- Earnings beats vs. misses: If banks disappoint, the rally could fizzle fast
- Fed commentary: Multiple Fed speakers this week, including Chair Powell on Tuesday
- Trade headlines: Any renewed tariff threats could send stocks tumbling again
S&P 500 Sectors: Tech and Consumer Discretionary Lead
Sector Performance Breakdown
Monday’s rally wasn’t a rising-tide-lifts-all-boats affair—it was decidedly tilted toward growth and cyclical sectors [2][11]:
- Information Technology: +2.47% (best performer)
- Consumer Discretionary: +2.29%
- Energy: +1.42%
- Financials: +0.96%
- Industrials: +1.04%
- Materials: +1.59%
- Health Care: -0.09%
- Consumer Staples: -0.33% (worst performer)
- Communication Services: Mixed reports (-0.55% to +0.92%)
- Real Estate: +0.50%
- Utilities: +1.59%
Tech’s Dominance
Technology stocks roared back, driven by semiconductor and software names. NVIDIA (NVDA), a bellwether for AI enthusiasm, posted solid gains as investors bet that the AI infrastructure buildout remains intact despite macro headwinds [2][12]. Broadcom’s (AVGO) recent deal with OpenAI also boosted sentiment across the chip sector [3].
Consumer Discretionary Strength
The +2.29% jump in consumer discretionary reflects optimism about consumer spending resilience, even as inflation remains above the Fed’s 2% target [2]. E-commerce and retail stocks benefited from expectations that holiday shopping could be robust, though rising credit card delinquencies remain a concern.
Defensive Sectors Lag
Consumer staples and health care underperformed, a classic sign that investors are rotating into riskier assets. When Procter & Gamble (PG) and Merck (MRK) lag, it usually means traders are feeling frisky—or at least less terrified [2][11].
Dow Jones Industrial Average: Banks and Industrials Drive Gains
What Moved the Dow
The Dow’s 1.29% gain was powered by a mix of financial and industrial heavyweights [13]:
- Top Gainers: Nike (NKE) +3.31%, Goldman Sachs (GS) +2.93%, NVIDIA (NVDA) +2.82%, Caterpillar (CAT) +2.74%, JPMorgan Chase (JPM) +2.41%
- Top Losers: Procter & Gamble (PG) -1.47%, Cisco (CSCO) -0.71%, Merck (MRK) -0.34%
Divergence or Convergence?
The Dow’s underperformance relative to the Nasdaq (1.29% vs. 2.21%) highlights the market’s preference for growth over value on Monday. However, the Dow’s gains were still respectable, suggesting that blue-chip stocks aren’t being left behind entirely. The index’s heavy weighting in financials—which kicked off earnings today—means its near-term fate is tied to bank results [13].
Earnings Spotlight
With JPMorgan, Goldman Sachs, Wells Fargo, and Citigroup all reporting before the bell, the Dow’s financial components are under the microscope. Analysts expect strong trading revenues but are watching for commentary on loan growth and credit quality [14].
Gold & Commodities: Safe Havens Shine, Oil Slumps
Gold Hits All-Time High
Gold surged to a new lifetime high of $4,067 per ounce on Monday, up 1.58% on the day, as investors piled into the ultimate safe-haven asset [15][16]. The rally was driven by:
- Negative real yields: With the 10-year Treasury yield at 4.01% and inflation running above 2%, real yields remain unattractive, boosting gold’s appeal [15][16]
- Geopolitical uncertainty: U.S.-China trade tensions and the ongoing government shutdown are fueling demand for non-dollar assets [15][16]
- Central bank buying: Global central banks, particularly in Asia and the Middle East, have been net buyers of gold as they diversify away from the dollar [15][16]
Analysts at Goldman Sachs and Deutsche Bank are now forecasting gold could hit $5,000 per ounce by 2026 if fiscal deficits worsen and the Fed cuts rates further [15].
Oil Slides Below $60
In stark contrast, crude oil prices tumbled to five-month lows:
- WTI crude: $57.74/barrel (-2.94%)
- Brent crude: $61.63/barrel (-2.67%) [17][18]
The selloff was driven by:
- Demand fears: Trade war concerns are raising the specter of a global economic slowdown, which would crimp oil consumption [17][18]
- Supply glut: The International Energy Agency forecasts a growing surplus in 2025-2026 as OPEC+ production increases outpace demand growth [17][18]
- Geopolitical easing: Progress toward a Gaza ceasefire has reduced the Middle East risk premium [17][18]
Copper Dips on Trade Worries
Copper, often seen as a barometer for global economic health, fell 3.47% to $4.93 per pound as traders fretted about Chinese demand [19]. With China accounting for roughly half of global copper consumption, any slowdown in the world’s second-largest economy is bad news for the red metal.
Bitcoin: Crypto Retreats Amid ETF Outflows
BTC Price Action
Bitcoin slipped to approximately $110,896 on Monday, down from highs above $112,000 earlier in the day [20]. The 2.54% decline came as traders digested a brutal weekend liquidation event that wiped out over $500 billion in crypto market value [20].
ETF Flows Turn Negative
Spot Bitcoin ETFs saw $326.5 million in net outflows on Monday, part of a broader $755 million exodus from combined Bitcoin and Ethereum ETFs [20]. Key flows:
- BlackRock’s IBIT: +$60.4 million (lone bright spot)
- Grayscale’s GBTC: -$145.4 million
- Bitwise’s BITB: -$115.6 million [20][21]
Cumulative net inflows for Bitcoin spot ETFs since their January 2024 launch remain positive at $62.4 billion, but the recent outflows signal caution among institutional investors [20][21].
What’s Driving the Weakness?
Analysts point to “post-liquidation caution” following Trump’s tariff threats, which triggered a wave of forced selling in leveraged crypto positions [20]. Bitcoin’s correlation with risk assets like tech stocks means it often moves in tandem with the Nasdaq—when equities wobble, crypto tends to follow.
Bonds & Interest Rates: Yields Dip, Curve Steepens
Treasury Market Overview
Treasury yields retreated on Monday as investors sought safety amid lingering uncertainty:
- 10-year yield: 4.01% (-13 bps from recent highs)
- 2-year yield: 3.48% (-3 bps)
- 30-year yield: ~4.25% (estimated) [6][7][8]
The 2s10s yield curve spread widened slightly to 0.53%, maintaining a positive slope that suggests markets aren’t pricing in imminent recession [8]. Historically, an inverted curve (where short-term yields exceed long-term yields) has been a reliable recession predictor, but we’re not there yet.
Fed Path: What’s Priced In?
According to the CME FedWatch tool, markets are pricing in:
- 99.3% probability the Fed holds rates at 3.75%-4.00% at the October 29 meeting
- 89.9% probability of a cut to 3.50%-3.75% by the December 10 meeting
- 53.8% probability of further cuts to 3.25%-3.50% by January 2026 [22]
This dovish pricing reflects expectations that the Fed will ease policy as inflation moderates and the labor market softens. However, the ongoing government shutdown has delayed key data releases like the Consumer Price Index (CPI), making it harder for the Fed to calibrate policy [23].
Impact on Equities
Lower yields are generally bullish for stocks, especially growth names, because they reduce the discount rate on future earnings. The recent dip in the 10-year yield has provided a tailwind for tech stocks, which are particularly sensitive to interest rate changes [6].
Macro Watch: Key Events This Week
Economic Data Releases
The week ahead is packed with potential market-movers, though the government shutdown could delay some reports [23][24]:
- Tuesday, October 15: NFIB Small Business Optimism Index (6:00 AM ET); Fed Chair Powell speaks (11:30 AM ET)
- Wednesday, October 16: Empire State Manufacturing Index (8:30 AM ET); Fed Beige Book (2:00 PM ET); CPI data delayed to October 24 due to shutdown
- Thursday, October 17: Weekly jobless claims, PPI, core PPI, retail sales (8:30 AM ET); Philadelphia Fed Manufacturing Index
- Friday, October 18: Housing starts, permits, industrial production (8:30 AM ET) [23][24]
Fed Speakers Galore
Multiple Federal Reserve officials are scheduled to speak this week, including Chair Jerome Powell on Tuesday. Markets will be parsing every word for clues about the pace of rate cuts and the Fed’s assessment of the shutdown’s economic impact [23][24].
Earnings Calendar
Beyond today’s bank bonanza, key reports this week include:
- Tuesday: Johnson & Johnson (JNJ), Domino’s Pizza (DPZ)
- Wednesday: Bank of America (BAC), Morgan Stanley (MS)
- Thursday: Netflix (NFLX), Tesla (TSLA)
- Friday: American Express (AXP), Procter & Gamble (PG) [14]
Risks and Counterpoints: Don’t Get Too Comfortable
Trade War Could Reignite
While Monday’s rally was fueled by hopes of de-escalation, the U.S.-China trade conflict is far from resolved. Trump’s tariff threats remain on the table, and China’s export restrictions on rare earth minerals could escalate into a full-blown economic war [1][2]. Any renewed hostilities could send stocks tumbling again.
Government Shutdown Drags On
The shutdown, now in its second week, is delaying critical economic data and raising concerns about fiscal stability [23][24]. If it extends into November, the impact on consumer sentiment and federal workers could weigh on growth.
Earnings Expectations Are Sky-High
With analysts forecasting 8.0% earnings growth for Q3 2025, there’s little room for disappointment [10]. If banks or tech giants miss estimates, the market could quickly reverse course.
VIX Remains Elevated
The VIX’s 16.24% spike to 22.12 suggests investors are hedging aggressively, even as stocks rally [4]. This elevated volatility reading is a warning sign that the market could whipsaw violently on any negative news.
Alternative Scenario: What If the Rally Fizzles?
If earnings disappoint or trade tensions flare up again, we could see a swift reversal. The S&P 500’s recent high near 6,700 could prove to be a double-top, with support at 6,400 and 6,200 if selling accelerates. Defensive sectors like utilities and consumer staples could outperform in such a scenario.
Quick Calendar: Key Dates Ahead
- Tuesday, October 15: Fed Chair Powell speaks (11:30 AM ET)
- Wednesday, October 16: Fed Beige Book (2:00 PM ET)
- Thursday, October 17: Jobless claims, PPI, retail sales (8:30 AM ET)
- Friday, October 18: Housing starts, industrial production (8:30 AM ET)
- Thursday, October 24: CPI data (delayed from October 16)
- Tuesday, October 29: Next FOMC meeting (no rate change expected)
- Tuesday, December 10: FOMC meeting (rate cut likely) [22][23][24]
Conclusion: Cautious Optimism, But Stay Alert
Monday’s rally was a welcome reprieve after last week’s carnage, but it’s too early to declare victory. The combination of eased trade tensions, strong earnings potential, and dovish Fed expectations has created a bullish backdrop—for now. However, the elevated VIX, ongoing government shutdown, and sky-high earnings expectations mean volatility is likely to persist.
What to Watch:
- Bank earnings results and guidance
- Fed commentary on rate cuts and shutdown impacts
- Any renewed trade war headlines
- CPI data on October 24 (delayed from this week)
- Bitcoin ETF flows as a sentiment gauge
For investors, this is a market that rewards nimbleness over complacency. Keep your eyes on earnings, your ears on Fed speakers, and your finger near the sell button—just in case.
Disclaimer
This blog post is for informational and educational purposes only and does not constitute investment advice. The author is not a licensed financial advisor. Market conditions can change rapidly, and past performance is not indicative of future results. Always conduct your own research and consult with a qualified financial professional before making investment decisions.
Sources
[1] https://www.cnn.com/markets
[2] https://www.edwardjones.com/us-en/market-news-insights/stock-market-news/daily-market-recap
[3] https://www.troweprice.com/personal-investing/resources/insights/global-markets-weekly-update.html
[4] https://www.cnbc.com/quotes/.VIX
[5] https://www.tradingview.com/symbols/TVC-DXY/
[6] https://www.cnbc.com/quotes/US10Y
[7] https://tradingeconomics.com/united-states/2-year-note-yield
[8] https://fred.stlouisfed.org/series/T10Y2Y
[9] https://www.google.com/finance/quote/.IXIC:INDEXNASDAQ?hl=en
[10] https://www.factset.com/earningsinsight
[11] https://www.sectorspdrs.com/sectortracker
[12] https://economictimes.indiatimes.com/news/international/us/u-s-stock-market-today-dow-sp-500-nasdaq-show-caution-is-a-crisis-brewing-top-stock-to-watch-now/articleshow/123528521.cms
[13] https://markets.businessinsider.com/index/market-movers/dow_jones
[14] https://www.benzinga.com/insights/earnings/25/10/48191292/earnings-scheduled-for-october-14-2025
[15] https://economictimes.indiatimes.com/news/international/us/gold-price-today-gold-price-unstoppable-rises-to-new-lifetime-high-at-4067/oz-will-gold-rate-continue-rising-or-face-a-sharp-correction-soon-bullion-analysts-share-gold-price-prediction/articleshow/124526179.cms
[16] https://www.pimco.com/gbl/en/resources/education/understanding-gold-prices
[17] https://oilprice.com/Energy/Energy-General/Oil-Drops-Below-60-on-Gaza-Ceasefire.html
[18] https://tradingeconomics.com/commodity/brent-crude-oil
[19] https://tradingeconomics.com/commodity/copper
[20] https://www.theblock.co/post/374493/spot-crypto-etfs-755-million-outflows
[21] https://farside.co.uk/btc/
[22] https://www.investing.com/central-banks/fed-rate-monitor
[23] https://www.kiplinger.com/investing/economy/this-weeks-economic-calendar
[24] https://tradingeconomics.com/united-states/calendar