Wall Street extends its winning streak to record highs as investors brace for a widely anticipated Federal Reserve rate cut and blockbuster earnings from Big Tech giants.
TL;DR
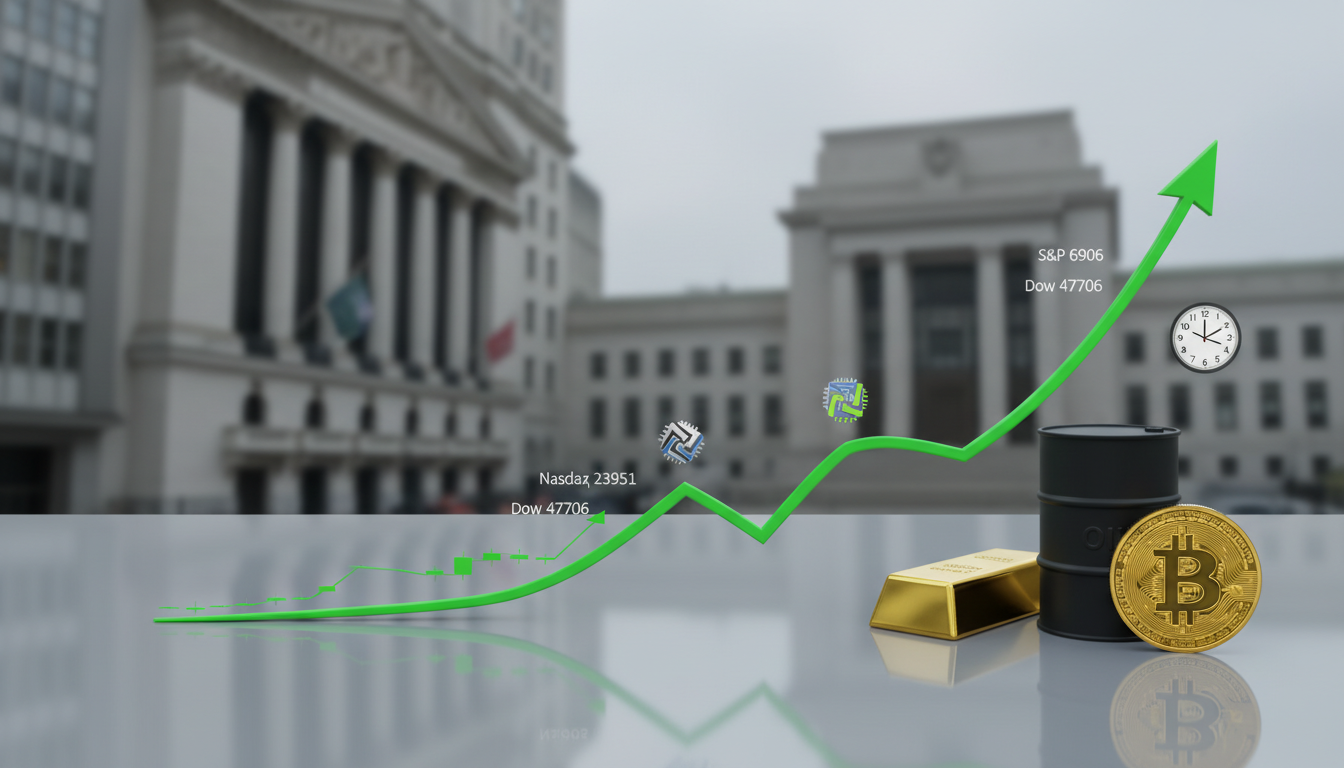
- S&P 500 climbs 0.25% to 6,906.95, Nasdaq surges 0.52% to 23,951, and Dow gains 0.3% to 47,706—all fresh records
- Fed expected to cut rates by 25 basis points to 3.75-4.00% range (97% probability) at 2 PM ET today
- Microsoft (MSFT), Alphabet (GOOGL), and Meta (META) report earnings after the bell with massive market implications
- Energy (+1.09%) and Industrials (+0.93%) lead sectors; Real Estate (-1.76%) and Consumer Staples (-1.49%) lag
- Gold holds near $4,000/oz on rate cut hopes; WTI crude rebounds 1.2% to $60.87 on inventory draws
- Bitcoin consolidates around $113K (-2-3%) as capital rotates into AI stocks
- U.S.-China trade deal optimism builds ahead of Trump-Xi meeting tomorrow
Introduction: A Market Riding High on Hope and Hype
October 29, 2025, is shaping up as one of those rare days when everything seems to align for equity bulls. The S&P 500, Nasdaq Composite, and Dow Jones Industrial Average are all trading at or near all-time highs, buoyed by a potent cocktail of dovish monetary policy expectations, stellar corporate earnings, and easing geopolitical tensions [1][2][3].
The Federal Reserve’s two-day policy meeting concludes today, with markets pricing in a near-certain 25-basis-point rate cut—the second consecutive reduction after September’s initial move [4][5]. Meanwhile, the “Magnificent Seven” tech titans are in the earnings hot seat, with Microsoft, Alphabet, and Meta set to report after the closing bell. If history is any guide, these reports could either cement the rally or trigger a sharp reversal [6][7].
Adding to the bullish narrative: whispers of a breakthrough in U.S.-China trade talks ahead of tomorrow’s Trump-Xi summit, inventory drawdowns supporting oil prices, and gold hovering near $4,000 as investors hedge their bets [8][9][10]. But beneath the surface, cracks are forming—Bitcoin is bleeding, defensive sectors are getting hammered, and the VIX is ticking higher despite the euphoria [11][12].
Let’s break down what’s really driving markets today and what investors should watch as we head into the final stretch of 2025.
Market Snapshot: Records Across the Board
Major Indices
- S&P 500 (^GSPC): 6,906.95, +0.25% (+17.32 points) [13]
- Dow Jones Industrial Average (^DJI): 47,706.37, +0.30% (+143 points) [14]
- Nasdaq Composite (^IXIC): 23,951.01, +0.52% (+124 points) [15]
- Russell 2000 (^RUT): 2,525.80, +0.77% (+19 points) [16]
All four major U.S. equity benchmarks are trading in the green, with the tech-heavy Nasdaq leading the charge. This marks the third consecutive session of gains for the Dow and fresh all-time highs for both the S&P 500 and Nasdaq [14][15].
Market Internals
Market breadth is moderately positive, though not overwhelmingly so. While specific advancer-decliner ratios for today weren’t available in real-time data, historical patterns suggest that when major indices hit records with modest gains (sub-1%), participation can be narrow—often driven by mega-cap tech stocks rather than broad-based buying [17]. Volume is running slightly below average, which could signal some caution ahead of the Fed announcement [18].
Fear Gauge & Dollar
- VIX (Volatility Index): 16.64, +1.34% (+0.22 points) [19]
- DXY (U.S. Dollar Index): 98.69, -0.04% [20]
The VIX remains subdued below 17, indicating low fear levels, but today’s uptick suggests some hedging activity ahead of the Fed decision. The dollar is drifting lower as rate cut expectations weigh on the greenback, making U.S. assets cheaper for foreign buyers [20][21].
S&P 500: What Happened, Why It Matters, What to Watch
What Happened
The S&P 500 notched another record close, extending its year-to-date gain to approximately 17-18% [13]. The index has been remarkably resilient despite headwinds like persistent inflation (core PCE at 2.9%), a weakening labor market, and geopolitical uncertainty [22][23].
Today’s move was driven by three key factors:
-
Fed Rate Cut Certainty: CME FedWatch Tool shows a 97% probability of a 25bp cut, down from the current 4.00-4.25% range [24]. This would mark the second consecutive cut, signaling the Fed’s pivot from inflation-fighting to growth-supporting mode.
-
Earnings Optimism: 83% of S&P 500 companies that have reported Q3 earnings have beaten estimates, with an average surprise of 8% [25]. This “fantastic” earnings season has provided fundamental support for elevated valuations.
-
AI Infrastructure Boom: Nvidia (NVDA) surged 2.4-2.5% to a fresh all-time high, pushing its market cap toward $5 trillion on news of AI partnerships and data center demand [26][27]. This lifted the entire Information Technology sector (+0.86%) and Communication Services (+0.57%) [28].
Why It Matters
The S&P 500’s ability to grind higher despite mixed economic signals underscores the market’s faith in two narratives: (1) the Fed will engineer a “soft landing” by cutting rates just enough to support growth without reigniting inflation, and (2) AI-driven productivity gains will offset macro headwinds [29][30].
However, concentration risk is extreme. The top 10 stocks now account for over 35% of the index’s market cap, meaning a stumble by any Magnificent Seven member could trigger outsized volatility [31]. Today’s after-hours earnings from MSFT, GOOGL, and META will be a critical test.
What to Watch
- Fed Chair Powell’s Press Conference (2:30 PM ET): Markets will parse every word for clues on the December meeting. Will Powell signal another cut, or hint at a pause? [32]
- Tech Earnings Guidance: Revenue growth and AI spending plans from Microsoft and Alphabet could set the tone for Q4 [33].
- Economic Data: Thursday’s Q3 GDP advance estimate (forecast: 3.2%) and Friday’s PCE inflation report will shape rate expectations for year-end [34][35].
S&P 500 Sectors: Winners, Losers, and the Rotation Story
The 11 GICS sectors showed sharp divergence today, reflecting a classic “risk-on” rotation into cyclicals and growth, with defensive areas getting crushed [28][36].
Leaders
-
Energy (XLE): +1.09% [28]
- Driver: WTI crude oil jumped 1.2% to $60.87/barrel on a massive 6.86 million-barrel inventory draw reported by the EIA—far exceeding the 0.2M forecast [37][38]. Brent crude rose 1.21% to $65.00 [39].
- Outlook: U.S. sanctions on Russian oil producers (Rosneft, Lukoil) are tightening supply, though skepticism remains about long-term impact [40]. OPEC+ may increase output by 137K bpd in December, capping upside [41].
-
Industrials (XLI): +0.93% [28]
- Driver: Caterpillar (CAT) soared 12.5% on strong earnings and guidance, signaling robust infrastructure and construction demand [42]. Boeing (BA) also reported this morning, with an implied earnings move of +/- 4.67% [43].
- Outlook: Trade deal optimism and potential fiscal stimulus could boost this sector, but tariff risks linger [44].
-
Information Technology (XLK): +0.86% [28]
- Driver: Nvidia’s AI dominance continues, with partnerships including a $1 billion stake in Nokia [45]. Microsoft and Apple both crossed $4 trillion market caps this week [46].
- Outlook: Earnings from MSFT and GOOGL tonight will determine if AI hype can justify sky-high valuations. Watch for cloud revenue growth and AI capex guidance [47].
Laggards
-
Real Estate (XLRE): -1.76% [28]
- Driver: Higher-for-longer interest rates (10Y yield at 4.00%) are crushing REITs and homebuilders [48]. Pending home sales data at 2 PM ET could add pressure [49].
- Outlook: Rate cuts should eventually help, but the sector remains vulnerable until yields drop meaningfully below 3.5% [50].
-
Consumer Staples (XLP): -1.49% [28]
- Driver: Defensive rotation out of low-growth, high-dividend stocks as investors chase cyclical upside. Kraft Heinz (KHC) reported earnings this morning with muted reaction [51].
- Outlook: Margin pressure from sticky inflation and weak pricing power could persist [52].
-
Financials (XLF): -1.03% [28]
- Driver: Flattening yield curve (2s10s spread at 0.52%) squeezes net interest margins for banks [53]. UnitedHealth (UNH) plunged 2.12% after cutting annual guidance despite beating Q3 estimates [54].
- Outlook: Rate cuts are a double-edged sword—lower rates help borrowers but hurt bank profitability [55].
Sector Takeaway
The market is betting on a Goldilocks scenario: strong enough growth to support cyclicals, but weak enough to justify Fed easing. If that narrative cracks—say, GDP comes in too hot or inflation reaccelerates—expect a violent rotation back into defensives [56].
Dow Jones Industrial Average: Blue-Chip Divergence
The Dow gained 0.3% to 47,706.37, its third straight record close [14]. But beneath the headline, performance was wildly uneven among the 30 components.
Top Gainers
- Caterpillar (CAT): +12.49% on blowout earnings [42]
- Nvidia (NVDA): +2.54% (yes, it’s in the Dow now—added in 2024) [57]
- Verizon (VZ): +2.44% after Q3 earnings beat at 8:30 AM ET [58]
Top Losers
- UnitedHealth (UNH): -2.12% on guidance cut [54]
- Apple (AAPL): -0.19% despite $4T market cap milestone, as AI delays weigh [59]
- Home Depot (HD): -0.31% on consumer spending concerns [60]
Divergence or Convergence?
The Dow’s outperformance relative to the S&P 500 (0.30% vs. 0.25%) is marginal, but the Russell 2000’s +0.77% gain suggests small-caps are finally catching a bid [16]. This could signal broadening participation—or just a head-fake before the next leg down. Equal-weight indexes have lagged cap-weighted ones all year, indicating the rally remains top-heavy [61].
Gold & Commodities: Hedging the Fed Pivot
Gold: $4,000 and Holding
- Spot Gold: $3,994-$4,017/oz, +0.69% to +1.24% [62][63]
- 52-Week Range: $2,537 – $4,530 [64]
Gold is consolidating near the psychologically critical $4,000 level, supported by three factors:
- Rate Cut Expectations: Lower rates reduce the opportunity cost of holding non-yielding gold [65].
- Inflation Hedge: Core PCE at 2.9% keeps real rates low, boosting gold’s appeal [66].
- Geopolitical Risk Premium: U.S.-China trade uncertainty and Middle East tensions underpin safe-haven demand [67].
Risks: A hawkish surprise from Powell (e.g., signaling a December pause) could trigger profit-taking. Forecasts suggest gold could hit $4,000-$4,100 by mid-2026 if the Fed continues easing [68].
Oil: Inventory Draws Trump Oversupply Fears
- WTI Crude: $60.87/barrel, +1.20% [69]
- Brent Crude: $65.00/barrel, +1.21% [70]
Oil prices rebounded sharply after the EIA reported a 6.86M barrel inventory draw—the largest in weeks [37]. Gasoline stocks fell 5.94M barrels, and distillates dropped 3.36M, signaling robust demand [71].
Bullish Factors:
- U.S. sanctions on Russian oil (Rosneft, Lukoil) disrupting supply [40]
- Inventory declines exceeding forecasts [37]
Bearish Factors:
- Oversupply concerns as U.S. production hits record highs [72]
- OPEC+ considering modest output increase [41]
- Analysts predict prices could dip below $60 if demand softens [73]
Copper & Industrial Metals
Copper prices were mixed, reflecting uncertainty about Chinese demand. A potential U.S.-China trade deal could boost industrial metals, but China’s property sector remains a drag [74].
Commodity Spillover to Equities
Energy stocks (XLE +1.09%) are the direct beneficiaries of oil’s rally, while gold miners saw modest gains. However, a stronger dollar (if the Fed disappoints) could reverse these moves quickly [75].
Bitcoin: The $113K Consolidation Conundrum
- Bitcoin (BTC/USD): $113,000, -2% to -3% over 24 hours [76][77]
- Market Cap: $2.21 trillion [78]
- 24H Volume: $63.7 billion [78]
Bitcoin is stuck in a tight range between $110K and $115K, underperforming equities despite a risk-on environment. Three dynamics are at play:
1. Capital Rotation into AI Stocks
Nvidia’s surge and anticipation of MSFT/GOOGL earnings are pulling speculative capital away from crypto. When tech stocks are ripping, Bitcoin often takes a backseat [79].
2. Fed Decision Uncertainty
While rate cuts are typically bullish for Bitcoin (lower rates = weaker dollar = higher BTC), the market may be waiting for confirmation before re-entering. A hawkish Powell could trigger a deeper pullback [80].
3. ETF Flows and Institutional Demand
Bitcoin ETFs have seen steady inflows, but not the explosive demand seen earlier in 2025. Analyst Geoffrey Kendrick (Standard Chartered) predicts BTC may never fall below $100K again if macro conditions improve, but that’s a big “if” [81].
Correlation with Risk Assets
Bitcoin’s correlation with the Nasdaq has weakened recently, suggesting it’s trading more on crypto-specific factors (e.g., regulatory news, ETF flows) than macro trends [82]. If stocks sell off post-Fed, BTC could decouple and rally as a true alternative asset—or it could crash in sympathy. Volatility is the only certainty.
Bonds & Interest Rates: The Curve Steepens (Slightly)
Treasury Yields
- 10-Year Yield: 4.00%, +0.02% (up 2 basis points) [83]
- 2-Year Yield: 3.50%, +0.004% (up 0.4 basis points) [84]
- 2s10s Spread: 0.52% (positive, indicating no inversion) [85]
The yield curve has steepened modestly over the past month, moving from inversion to a positive slope. This is typically a bullish signal for equities, as it suggests the market expects growth to reaccelerate after the Fed cuts rates [86].
Fed Path: What CME FedWatch Says
- October 29 Meeting: 97% probability of 25bp cut to 3.75-4.00% [24]
- December 10 Meeting: 79.6% probability of another 25bp cut to 3.50-3.75% [87]
- 2026 Outlook: Futures imply 2-3 more cuts by mid-2026, bringing rates to ~3.00-3.25% [88]
Impact on Equities
Lower rates are unambiguously bullish for stocks—they reduce discount rates (boosting valuations), lower borrowing costs (helping growth), and push investors out of bonds into equities (the “TINA” trade: There Is No Alternative) [89].
But here’s the catch: If the Fed is cutting because the economy is weakening (not just because inflation is cooling), that’s bearish. The market is betting on the former; if it’s the latter, watch out below [90].
What to Watch
- Powell’s Dot Plot Commentary: Will the Fed signal more cuts in 2026, or hint at a pause? [91]
- Inflation Data: Friday’s PCE report (forecast: 2.8% core) will determine if the Fed has room to keep easing [92]
- Yield Curve Dynamics: If the 2s10s spread widens above 0.75%, it could signal stronger growth expectations and support cyclical stocks [93].
Macro Watch: Key Data & Events This Week
Wednesday, October 29
- 2:00 PM ET: FOMC rate decision (expected: -25bp to 3.75-4.00%) [94]
- 2:30 PM ET: Fed Chair Powell press conference [95]
- After Hours: Earnings from MSFT, GOOGL, META, SBUX, CMG, EBAY [96]
Thursday, October 30
- 8:30 AM ET: Q3 GDP Advance (forecast: 3.2%, prior: 3.8%) [97]
- 8:30 AM ET: Weekly Jobless Claims (forecast: 223K-257K initial) [98]
- All Day: Trump-Xi meeting on U.S.-China trade deal [99]
Friday, October 31
- 8:30 AM ET: Personal Income & Spending (September) [100]
- 8:30 AM ET: PCE Price Index (forecast: 2.8% core YoY) [101]
- 8:30 AM ET: Employment Cost Index (Q3) [102]
- 9:45 AM ET: Chicago PMI (October) [103]
Why It Matters
This is one of the most data-dense weeks of the year. The Fed decision, GDP, and PCE inflation will shape the narrative for Q4. If GDP comes in hot (>3.5%) and PCE stays sticky (>2.9%), the Fed may signal a December pause, which could trigger a correction. Conversely, weak GDP (<3.0%) and cooling inflation would greenlight more cuts and fuel the rally [104][105].
Risks and Counterpoints: What Could Go Wrong?
1. Hawkish Fed Surprise
If Powell signals a December pause or raises concerns about inflation, the market could tank. The 97% probability of a cut today leaves little room for a positive surprise, but plenty of downside risk [106].
2. Disappointing Tech Earnings
Microsoft, Alphabet, and Meta account for ~15% of the S&P 500’s market cap. If any of them miss on revenue or guide lower, it could erase weeks of gains in a single session [107].
3. U.S.-China Trade Deal Flop
Tomorrow’s Trump-Xi meeting is priced in as a positive. If talks collapse or tariffs escalate, risk assets (stocks, Bitcoin, commodities) could all sell off in unison [108].
4. Recession Signals
The labor market is weakening (job losses in June, minimal gains in August), and the yield curve only recently un-inverted—historically, recessions follow 6-24 months after inversion [109][110]. The market may be too complacent.
5. Geopolitical Wildcard
Middle East tensions, Ukraine-Russia escalation, or a surprise from China (e.g., rare earth export controls) could spike the VIX and trigger a flight to safety [111].
Quick Calendar: Key Dates Ahead
| Date | Event | Time (ET) | Importance |
|---|---|---|---|
| Oct 29 | FOMC Rate Decision | 2:00 PM | 🔥🔥🔥 |
| Oct 29 | Powell Press Conference | 2:30 PM | 🔥🔥🔥 |
| Oct 29 | MSFT, GOOGL, META Earnings | After Hours | 🔥🔥🔥 |
| Oct 30 | Q3 GDP Advance | 8:30 AM | 🔥🔥 |
| Oct 30 | Trump-Xi Meeting | TBD | 🔥🔥 |
| Oct 31 | PCE Inflation | 8:30 AM | 🔥🔥 |
| Nov 1 | ISM Manufacturing PMI | 10:00 AM | 🔥 |
| Dec 10 | Next FOMC Meeting | 2:00 PM | 🔥🔥 |
Conclusion: Riding the Wave or Catching a Falling Knife?
Today’s market action is a masterclass in cautious optimism. Stocks are at records, the Fed is cutting rates, earnings are beating, and geopolitical risks are (temporarily) fading. It’s the kind of setup that makes you want to go all-in on tech and cyclicals.
But here’s the reality check: Markets are priced for perfection. Any stumble—a hawkish Powell, a tech earnings miss, a trade deal collapse—could trigger a sharp reversal. The VIX is low, but it’s ticking higher. Bitcoin is bleeding despite a risk-on environment. Defensive sectors are getting annihilated, which often happens right before a rotation.
For investors, the playbook is clear:
- Watch the Fed: Powell’s 2:30 PM press conference will set the tone for Q4. If he signals more cuts, stay long. If he hints at a pause, trim risk.
- Monitor Tech Earnings: MSFT, GOOGL, and META will determine if AI hype can justify valuations. Guidance matters more than Q3 results.
- Diversify: Don’t chase the rally blindly. Keep some cash, own gold as a hedge, and consider defensive sectors if macro data weakens.
- Stay Nimble: This market can turn on a dime. Use stop-losses, avoid over-leveraging, and be ready to pivot.
The bull case is intact—for now. But in a market this extended, the difference between a hero and a zero is often just one bad headline.
Stay sharp, stay diversified, and don’t bet the farm on any single outcome.
Disclaimer
This blog post is for informational and educational purposes only and does not constitute financial, investment, or trading advice. The author is not a licensed financial advisor, and the content herein should not be construed as a recommendation to buy, sell, or hold any securities, commodities, or other financial instruments.
All data, statistics, and market commentary are based on publicly available information as of October 29, 2025, and are subject to change. Past performance is not indicative of future results. Investing in stocks, bonds, commodities, cryptocurrencies, and other assets involves risk, including the potential loss of principal.
Readers should conduct their own research and consult with a qualified financial professional before making any investment decisions. The author assumes no liability for any financial losses or damages resulting from the use of this information.
Trade responsibly. Markets can be unforgiving.
Sources
- Yahoo Finance – Stock Market Today: Dow, S&P 500, Nasdaq Eye Fresh Records
- CNBC – Stock Market Today Live Updates (October 27, 2025)
- Investopedia – Dow Jones Today: October 28, 2025
- Edward Jones – Daily Market Recap
- Kiplinger – This Week’s Economic Calendar
- TipRanks – Stocks Reporting Earnings Today (October 29, 2025)
- Yahoo Finance – Earnings Calendar
- Trading Economics – Gold Price
- OilPrice.com – WTI Crude Oil News
- CoinMarketCap – Bitcoin Price
- CNBC – VIX Quotes
- TradingView – S&P 500 Sectors
- YCharts – S&P 500 Index
- Markets Insider – Dow Jones Market Movers
- Google Finance – Nasdaq Composite
- CNBC – Russell 2000 Quotes
- Fidelity – Advance/Decline Line
- CNN Markets
- CBOE – VIX Volatility Index
- TradingView – DXY Dollar Index
- Investing.com – US Dollar Index
- CBS News – Federal Reserve FOMC Meeting Forecast
- Morningstar – What to Expect at October 2025 Fed Meeting
- CME Group – FedWatch Tool
- Investopedia – 5 Things to Know Before Market Opens (October 29, 2025)
- Yahoo Finance – Stock Market Today: Dow, S&P 500, Nasdaq Notch Fresh Records
- CNBC – Nvidia Stock
- Fidelity – Sector Performance
- Business Insider – Stock Market Outlook Analysis
- NYSE – Index
- S&P Global – US Sector Dashboard
- Federal Reserve – FOMC Calendar
- TipRanks – Options Volatility and Implied Earnings Moves
- Trading Economics – United States Calendar
- TradingView – Economic Calendar
- Novel Investor – Sector Performance
- QC Intel – Oil Futures Prices Higher After Drop in US Crude Inventories
- OilPrice.com – US Crude Oil Inventories Continue to Fall
- Trading Economics – Brent Crude Oil
- OilPrice.com – Oil Prices Dip As Oversupply Concerns Mount
- Reuters – View: US 2s10s Treasury Yield Curve Inverts
- SlickCharts – Dow Jones Gainers
- TipRanks – Earnings Calendar
- Schwab – Stock Sector Outlook
- Economic Times – Why is US Stock Market Booming Today?
- Kiplinger – Stocks Hit Fresh Highs Ahead of the Fed
- Yahoo Finance – Stock Market News
- CNBC – US 10-Year Treasury Yield
- FRED – 10-Year Treasury Rate
- Britannica – Stock Sector Performance
- Verizon – Earnings Report October 29, 2025
- MacroMicro – S&P Sector Performance
- YCharts – 10-2 Year Treasury Yield Spread
- Markets Insider – Dow Jones Market Movers
- Investopedia – Dow Jones Today: October 23, 2025
- Barchart – Market Performance
- SlickCharts – Market Movers
- Yahoo Finance – Verizon to Report Earnings
- Yahoo Finance – Wall Street Braces for $6.6T
- Sector SPDRs – Sector Tracker
- GuruFocus – 10-2 Treasury Yield Spread
- GoldPrice.org – Live Gold Price
- GoldPrice.org – Spot Gold
- Forbes – Gold Price
- Investopedia – What Drives the Price of Gold
- Bloomberg – Factors Driving Gold Price to New Highs
- GoldPrice.org – Gold Price History
- APMEX – Gold Price
- CNBC – WTI Crude Oil Quotes
- Investing.com – Brent Oil
- Bloomberg Energy
- FX Empire – Oil News: WTI Futures Eye Support Zone
- FX Empire – Crude Oil Price Outlook
- Commodity.com – Oil Price
- DailyFX – US Dollar Index
- Kraken – Bitcoin Price
- CoinDesk – Bitcoin Sinks Below $113K
- CoinMarketCap – Bitcoin
- Bitcoin Magazine – Bitcoin Price Jumps to $115,000
- Yahoo Finance – Bitcoin Price
- Binance – Bitcoin Price
- Robinhood – Bitcoin
- Trading Economics – United States Government Bond Yield
- CNBC – US 2-Year Treasury Yield
- FRED – 10-Year Minus 2-Year Treasury Yield
- Brookings – The Rise in Long-Term US Treasury Yields
- Investing.com – Fed Rate Monitor
- EconForecasting – T02Y Forecast
- YCharts – 2-Year Treasury Rate
- CAIA – Trading 2s10s Inversion
- Simplify – Trading 2s10s Inversion
- BLS – News Releases
- MacroMicro – US 10-2 Yield Curve
- Investopedia – CME FedWatch Tool
- CME Group – Understanding the FedWatch Tool Methodology
- Earnings Whispers – Calendar
- New York Fed – National Economic Calendar
- Trading Economics – Economic Calendar
- Reuters – Fed in Fog as It Heads Toward Another Rate Cut
- FRED – Economic Calendar
- Yahoo Finance – Economic Calendar
- Kiplinger – October Fed Meeting Live Updates
- Kiplinger – When is the Next Fed Meeting
- Investopedia – Next Fed Meeting
- Atlanta Fed – Market Probability Tracker
- CME Group – FedWatch Tool User Guide
- CME Group – FedWatch Tool Aggregated Enhancement
- CME Group Education – Understanding STIR Futures
- ForexLive – Eyes on the Yield Curve: US 2s10s Dis-Inverts
- BNY – Yield Curve Watch
- Economic Times – US Stock Market Today: Why Are Dow, S&P 500, and Nasdaq All Rising?